
AI-enabled Employee Sentiment & Attrition Early Warning System:
Technical Whitepaper on Solution Architecture, Predictability Model, Implementation Learnings and Impact Improvement
Executive Summary
Undesired attrition rarely appears suddenly. It is usually preceded by a combination of latent signals: reduced work quality, slower cycle time, changes in collaboration patterns, negative comments, manager relationship deterioration, compensation dissatisfaction, repeated unresolved issues, lower engagement and weak career visibility. Traditional HR analytics detects only a fraction of this pattern because HRMS, engagement surveys and exit interviews are delayed, episodic and self-reported. A predictive Early Warning System (EWS) must therefore integrate data from the systems employees use every day.
The discussed EWS is a multi-signal, time-aware and explainable AI platform. It uses enterprise telemetry from HRMS, PMS, work management, engineering, ticketing, finance, collaboration and learning systems to estimate attrition risk, detect sentiment deterioration and trigger supportive interventions before the employee becomes irreversibly disengaged. The technical design combines natural-language processing, trend analytics, anomaly detection, supervised classification, survival analysis, explainability, model monitoring and human-in-the-loop governance.
The system is not designed to label employees as loyal or disloyal. It is designed to detect risk patterns and recommend timely, ethical and evidence-backed support. It must never be used for punitive decisions, performance downgrade, forced retention or covert surveillance. Responsible deployment requires transparency, purpose limitation, data minimization, access segregation, protected-attribute controls, bias testing and intervention governance aligned with NIST AI RMF, Microsoft Responsible AI principles, DPDP Act expectations for India and high-risk workplace AI expectations under the EU AI Act for multinational deployments.
| Dimension | Technical position |
| Core prediction problem | Estimate probability of undesired attrition in 30/60/90 days and expected time-to-exit while identifying actionable risk drivers. |
| Primary hypothesis | Attrition predictability improves when HR data is fused with operational work-system signals, quality trends and textual sentiment. |
| Model design | Hybrid ensemble using NLP, quality trend features, anomaly detection, tree-based supervised model, survival model and explainability layer. |
| Primary consumers | HRBPs, people managers, leadership, employee experience teams, workforce planning and retention task forces. |
| Control boundary | System recommends supportive intervention; humans decide actions; employment decisions should not be made solely by model output. |
Why Employee sentiment EWS must go beyond HR data
Employee sentiment is not contained inside HR surveys. Survey responses are sparse, delayed and biased by response fatigue or fear of disclosure. Exit interviews arrive after the decision is already made. PMS comments can be useful, but they are episodic and often sanitized. In contrast, day-to-day enterprise systems carry behavioral residue: work quality, throughput, blocked tasks, rework, escalation, collaboration intensity, leave pattern, build failures, unresolved grievances, learning participation and contextual stressors.
A hard technical EWS therefore requires a multi-system data mesh. Each system contributes one or more signal types: behavioral, transactional, linguistic, relational, workload, career, compensation or organization-event signals. No single signal should trigger an alert. The platform must use corroborated signal clusters and temporal deterioration against individual and peer baselines.
| Legacy HR-only approach | Enterprise EWS approach |
| Annual/quarterly surveys | Continuous signal refresh with weekly risk scoring. |
| Self-reported sentiment | Observed behavior plus voluntary comments and HR events. |
| Population-level dashboards | Individual risk queues with strict access controls and explanation. |
| Attrition analysis after exit | Lead-time prediction and structured intervention before exit. |
| Correlation dashboards | Calibrated models, survival curves, reason codes and impact measurement. |
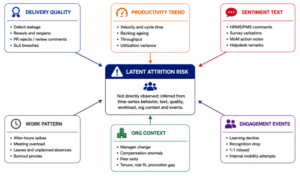
Figure 1.Signal ontology: multiple enterprise systems infer latent disengagement risk.
Target Outcomes and Impact Hypothesis
The business objective is not just model accuracy. The objective is substantive predictability that leads to controlled reduction in undesired attrition, improved employee experience and better leadership accountability. A technically good model can still fail if alerts are late, explanations are weak, interventions are generic or employee trust is damaged.
| Outcome | Technical metric | Operating metric |
| Earlier detection | Median lead time before resignation / exit event | Percentage of high-risk cases detected before manager awareness. |
| Better precision | Precision@K, positive predictive value, calibration error | HRBP time spent on true risk case. |
| Better coverage | Recall at agreed risk threshold | Proportion of regretted exits appearing in prior risk watchlist. |
| Actionability | SHAP reason coverage, next-best-action mapping coverage | Intervention acceptance, completion and time-to-action. |
| Fairness and trust | Group-wise false-positive/false-negative parity; access audit findings | Employee concerns, grievance count, opt-out or notice-related issues where applicable. |
The impact hypothesis is: if the organization can detect negative sentiment or quality degradation 4-12 weeks earlier and route cases to trained HRBP/manager interventions, a portion of otherwise undesired exits becomes addressable. The value depends less on algorithm sophistication alone and more on signal coverage, intervention quality, managerial trust and feedback-loop discipline.
Source-system landscape and Data contract
The EWS must maintain a formally governed source-system catalogue. Every data element requires a purpose, legal basis, owner, sensitivity classification, retention rule and business interpretation. The table below lists representative sources. It is not a complete list and must be tailored to the enterprise architecture.
| Role / Function | Source systems | Representative signals | Primary EWS use |
| Developers / Engineering | JIRA, GitHub/GitLab, Jenkins, SonarQube, code review tools, incident systems | Cycle time, story throughput, failed builds, PR review rejection, defect density, rework ratio, security findings, sprint spillover | Detect quality/productivity decline, overload, burnout indicators and project friction. |
| Customer Support | ServiceNow, Freshdesk, Zendesk, Genesys, CRM, QA scorecards | Ticket aging, reopen rate, CSAT trend, escalation rate, sentiment of customer/agent notes, SLA misses | Detect service-quality deterioration and emotional fatigue risk. |
| Finance | ERP, bookkeeping, payroll, banking integrations, expense tools, closing calendars | Invoice error rate, reconciliation delay, exception handling, payroll queries, month-end workload spikes | Detect workload stress, error increase and conflict around compensation/benefits. |
| HR / TA / People Ops | HRMS, PMS, ATS, LMS, engagement tools, grievance systems, MoM repositories | PMS comments, learning decline, internal mobility attempts, grievance text, 1:1 cadence, manager changes | Detect career frustration, manager issues, engagement decline and mobility signals. |
| Sales / Customer Success | CRM, CPQ, call notes, incentive systems, forecast reviews | Pipeline movement, activity drop, deal slippage, incentive disputes, customer escalations | Detect motivation decline, role-fit issues and variable-pay dissatisfaction. |
| All employees | Collaboration tools, calendars, surveys, recognition, leave systems | Meeting overload, recognition decline, leave anomalies, survey sentiment, collaboration network shifts | Detect burnout, disengagement and social detachment with strict privacy controls. |
Data contract controls should include source owner approval, field-level data dictionary, schema version, event timestamp, employee identifier mapping, role/team hierarchy, consent/notice attributes, ingestion frequency, allowed use, retention rule, data quality thresholds, lineage metadata and downstream model usage.
Reference Architecture
The architecture is cloud-native, event-aware and governance-first. A typical implementation uses API-based connectors for SaaS systems, CDC or scheduled ingestion for internal databases, streaming for high-frequency engineering/ticketing events, and a lakehouse or warehouse layer for curated analytic features. Feature generation should be separated from model training and model serving through a feature store so that online and offline features remain consistent.
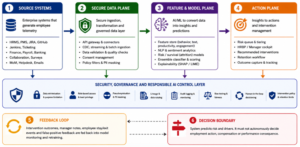
Figure 2. Reference architecture: ingestion, feature plane, model plane, action plane and governance layer.
| Layer | Core components | Design notes |
| Source connectivity | REST APIs, webhooks, Kafka/EventBridge/PubSub, CDC, SFTP, database connectors | Use least-privilege service accounts, source-specific throttling and schema drift detection. |
| Landing and lakehouse | Raw zone, validated zone, curated zone, PII vault, quarantine zone | Separate raw immutable data from privacy-filtered analytic features. |
| Identity resolution | Employee master, role/team hierarchy, project allocation, manager graph | Use stable surrogate IDs; avoid exposing direct identifiers to model-development workspaces. |
| Feature store | Batch and streaming features, point-in-time joins, feature lineage | Preventing leakage by ensuring features are available only as of the prediction date. |
| Model serving | Batch scoring, risk APIs, alert scheduler, explanation service | Weekly scoring is usually sufficient; high-frequency scoring can create noise. |
| Action workflow | Case queue, HRBP triage, manager playbook, intervention tracker | Alerts must be reviewable, explainable and converted into supportive action. |
| Observability | Data quality, model drift, fairness metrics, alert outcomes, audit logs | Operationalize the model like a critical system, not a one-time analytics dashboard. |
Signal Ontology and Feature Engineering
The strongest design principle is baseline-relative trend detection. An engineer with consistently high throughput should not be compared naively with a finance analyst. An employee in a high-pressure release window should not be treated the same as a steady-state employee. The feature layer must therefore calculate deltas against self-baseline, peer-baseline and role/project context.
| Feature family | Examples | Technical implementation |
| Velocity and throughput | Completed tickets, story points, commits, closed cases, reconciliations, processed invoices | Rolling windows: 7/14/30/60 days; self-baseline z-score; peer percentile within role/team. |
| Quality degradation | Defect leakage, reopen ratio, PR rejections, build failures, customer QA score decline, rework | EWMA trend, CUSUM change detection, slope, variance spike, anomaly score. |
| Workload and burnout proxies | After-hours work, meeting load, ticket queue pressure, month-end spikes, leave anomalies | Use aggregate/non-invasive telemetry; avoid biometric/emotion surveillance; measure deviation from normal pattern. |
| Text sentiment and intent | HRMS comments, PMS text, survey verbatim, grievance notes, ticket comments, MoM actions | Transformer embeddings, sentiment classifier, topic modelling, toxicity/frustration keywords, resignation-intent patterns. |
| Career and reward context | Promotion waits, compensation percentile, manager change, internal mobility attempt, recognition decline | Join HR and org events using point-in-time snapshots and privacy-filtered fields. |
| Collaboration and social context | Missed 1:1 cadence, low recognition, repeated blockers, cross-team escalation | Graph features and event counts; avoid private-message content unless explicitly governed and legally permissible. |
Feature engineering must avoid leakage. Examples of leakage include using resignation date, exit interview content, final settlement activity, notice-period workflows or manager-entered retention actions as predictive features before those events are known. A temporal split and point-in-time feature store are mandatory.
Prediction Algorithms and Model Design
Attrition early warning is not a single-model problem. It is a multi-horizon, censored-time, sparse-label and intervention-dependent problem. A robust architecture uses complementary models rather than one black-box classifier.
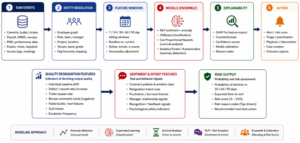
Figure 3. Prediction pipeline and model ensemble.
| Model / method | Purpose | Why it is useful | Primary caveat |
| Gradient-boosted trees: XGBoost / LightGBM / CatBoost | 30/60/90-day attrition probability | Strong performance on tabular, mixed and non-linear enterprise features; can support SHAP explanations. | Needs calibration and bias testing; can overfit if leakage is not controlled. |
| Logistic regression baseline | Transparent baseline and benchmark | Useful for audit, stability and executive explanation. | May underfit non-linear signals. |
| Survival analysis: Cox proportional hazards / AFT / random survival forests | Time-to-event risk and changing hazard over tenure | Handles censored employees who have not exited; predicts timing rather than only binary exit. | Needs careful assumptions, censoring treatment and time-varying covariates. |
| Anomaly detection: Isolation Forest / robust z-score / autoencoder | Detect unusual behavior shift without relying only on exit labels | Useful where attrition labels are rare or delayed. | Anomaly is not equal to attrition; needs corroboration and context. |
| NLP sentiment / intent model | Extract affect, frustration, intent and themes from text comments | Captures signals missed by numeric HR data. | Must handle sarcasm, language mix, privacy, fairness and domain drift. |
| Change-point and trend models: EWMA / CUSUM / Bayesian change point | Detect degradation over weeks | Good for quality drop, workload stress and trend reversal. | Needs baseline selection and seasonality controls. |
| Uplift / causal model | Estimate who may benefit from retention intervention | Improves intervention targeting and avoids wasting HRBP effort. | Requires intervention history and careful causal design. |
SHAP is recommended for feature attribution because it provides a unified additive feature-importance framework and is widely used for explaining complex ML predictions [S5]. However, SHAP should be treated as explanation of the model, not proof of causality. For intervention design, reason codes should be grouped into actionable categories such as workload, manager relationship, career stagnation, compensation dissatisfaction, quality decline, project friction or wellbeing risk.
Quality-degradation detection by role family
A central design requirement is detecting whether output quality is reducing over a few weeks. The logic must be role-specific because quality means different things in engineering, support, finance and HR. The model should calculate deterioration against self-baseline and peer-context, then corroborate it with sentiment or organizational signals before generating a risk alert.
| Role family | Quality indicators | Trend logic | Potential attrition interpretation |
| Developers | Failed builds, defect leakage, reopened bugs, PR rejection, code churn, static-analysis findings, story spillover | EWMA rise in failed builds; CUSUM jump in rework; 30-day decline in accepted PR ratio | Burnout, role mismatch, project conflict, disengagement or low support. |
| Support | SLA misses, reopened tickets, escalation ratio, CSAT drop, low QA score, knowledge-base miss | Rolling CSAT/QA decline; increase in escalations per ticket; sentiment shift in notes | Emotional fatigue, customer stress, inadequate tooling, manager conflict. |
| Finance | Reconciliation delay, journal correction, invoice exception, payroll query aging, close-calendar spillover | Month-end adjusted baseline; error ratio change; aging trend | Workload pressure, control fatigue, dissatisfaction with process or rewards. |
| HR | Ticket backlog, candidate drop-off, delayed onboarding, grievance aging, PMS workflow delay | Case aging, SLA breach rate, repeat employee queries | Burnout from people escalations, low role clarity, organizational pressure. |
| Sales / CS | Deal slippage, forecast variance, CRM hygiene decline, activity drop, escalation growth | Quarterly seasonality adjusted trend; incentive and territory context | Motivation decline, compensation dissatisfaction, territory issue or market challenge. |
Quality signals must not be treated as performance-management evidence. They should be used as early warning indicators for support. A temporary quality drop may be caused by external constraints, tool issues, health issues, team dependency or unrealistic workload. Hence every alert must pass through human contextual triage.
Sentiment, Intent and Text Analytics
Textual signals are often the earliest explicit clues. Employees may express dissatisfaction in PMS comments, HRMS tickets, survey verbatims, internal mobility reasons, grievance descriptions, exit-risk conversations, MoM action items or helpdesk remarks. The NLP pipeline should extract sentiment, emotion, topics and intent while keeping privacy and purpose limitation as first-class requirements.
| NLP component | Recommended design | Output |
| Text ingestion | Use governed text fields only; exclude private chats unless explicitly approved, noticed and proportionate. | Cleaned, timestamped and source-tagged text event. |
| Language handling | Detect language, code-mix and domain acronyms; use multilingual transformer where required. | Language and confidence metadata. |
| Sentiment classification | Domain fine-tuned sentiment model: positive/neutral/negative plus confidence. | Sentiment score and trend. |
| Emotion / theme extraction | Classify frustration, burnout, conflict, career concern, compensation concern, recognition issue, workload issue. | Actionable topic vector. |
| Intent detection | Detect resignation intent, internal-mobility intent, escalation intent, grievance intent. | High-sensitivity flags requiring human review. |
| Summarization | Generate privacy-safe, evidence-linked reason summary for HRBP. | No raw sensitive excerpts unless access is explicitly authorized. |
Do not use crude keyword matching alone. A phrase such as “I cannot continue like this” may be a serious risk signal in a grievance context but harmless in a project-planning context. Context-aware embeddings and human review are necessary. The system should store text-derived features and governed evidence links rather than unnecessarily duplicating raw text.
Risk scoring, Explainability and Intervention Design
A useful EWS produces a risk score, confidence band, lead-time estimate, reason codes and recommended intervention. A score without a reason leads to distrust. A reason without a playbook leads to inaction. An intervention without outcome capture destroys learning.
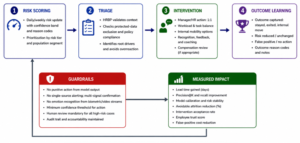
Figure 4. Alert triage and human intervention feedback loop.
| Risk band | Example threshold logic | Action protocol |
| Watch | 30/60/90-day attrition risk moderately above baseline; weak corroboration | No intrusive action. Monitor trend; manager to ensure regular 1:1 and workload visibility. |
| Concern | High risk with two or more corroborated signal families or sharp deterioration | HRBP triage, manager coaching, structured check-in, workload or career-path review. |
| Critical | Very high calibrated risk, strong negative text signal, or severe quality/workload trend with context | HRBP-led intervention plan, senior manager involvement where appropriate, documented support action and follow-up. |
| Do-not-alert | Low confidence, protected data sensitivity, insufficient evidence or likely false-positive condition | Suppress or route to model review; do not expose to manager dashboard. |
Intervention design should be mapped to reason codes. Workload risk maps to capacity planning or deadline renegotiation. Career risk maps to role conversation, skill plan or internal mobility. Manager relationship risk maps to skip-level conversation or coaching. Compensation risk maps to benchmarking and communication. Quality-degradation risk maps to support diagnosis, not punishment.
Cloud, MLOps and Data Platform Design
The system should be implemented as a governed analytical product. Reference technology choices can be mapped to AWS, Azure or GCP. The design below is cloud neutral.
| Capability | AWS-style implementation | Azure-style implementation | GCP-style implementation |
| Ingestion | AppFlow, Glue, Lambda, EventBridge, MSK/Kinesis | Data Factory, Event Hub, Functions | Dataflow, Pub/Sub, Cloud Functions |
| Lakehouse / warehouse | S3, Glue Catalog, Athena/Redshift, Lake Formation | ADLS, Purview, Synapse/Fabric | Cloud Storage, Dataplex, BigQuery |
| Feature store | SageMaker Feature Store / Feast | Azure ML Feature Store / Feast | Vertex AI Feature Store / Feast |
| Model training | SageMaker, MLflow | Azure ML, MLflow | Vertex AI, MLflow |
| Orchestration | Step Functions, MWAA/Airflow | Data Factory, Airflow, Logic Apps | Composer/Airflow, Workflows |
| Serving and alerts | Batch transform, API Gateway, Lambda, QuickSight | Managed online endpoint, Power BI, Logic Apps | Vertex endpoints, Looker, Cloud Run |
| Security | KMS, IAM, Lake Formation, CloudTrail, GuardDuty | Key Vault, Entra ID, Purview, Sentinel | KMS, IAM, VPC-SC, Audit Logs, SCC |
MLOps requirements include model registry, experiment tracking, reproducible pipelines, versioned datasets, feature lineage, automated validation, human approval gates, challenger models, drift monitoring, calibrated threshold review, rollback and incident handling. Because attrition is low-frequency and intervention changes outcomes, model evaluation must include time-based validation and post-deployment monitoring rather than one-time random train-test split.
Data Security, Privacy and Responsible AI Controls
Employee sentiment EWS is a high-trust system. Technically, it must be designed as if misuse is possible. The system should therefore implement privacy-by-design, security-by-design and responsible-AI-by-design.
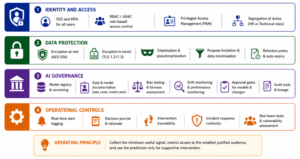
Figure 5. Security and privacy control architecture.
| Risk | Control design |
| Surveillance perception | Publish clear employee notice, purpose statement, data categories, access roles, and support-only use boundary. |
| Sensitive data misuse | Exclude protected attributes from model features except for fairness testing in controlled environment; apply masking and access approvals. |
| Manager misuse | Manager dashboard should show actionable support themes, not raw sensitive text or unexplained risk labels. |
| False positives | Require evidence threshold, confidence band, triage, case notes and suppression rules. |
| Bias and discrimination | Perform group-wise performance testing; investigate adverse false-positive/false-negative patterns. |
| Data breach | Encrypt data, pseudonymize analytic IDs, apply ABAC/RBAC, monitor access, maintain audit logs and incident response. |
| Function creep | Use purpose tags, legal approval workflow, retention limits and change-control board for any new data source/use case. |
NIST AI RMF provides a risk-management framework for AI risks to individuals, organizations and society [S1]. Microsoft Responsible AI principles emphasize fairness, reliability/safety, privacy/security, inclusiveness, transparency and accountability [S2]. The EU AI Act treats AI used in employment and worker management as high-risk in relevant contexts, and the Act also draws specific boundaries around certain workplace emotion-recognition use cases [S3]. India’s DPDP Act recognizes both the right to protect personal data and the need to process personal data for lawful purposes [S4]. These frameworks support the design position that the EWS must be transparent, human-supervised, proportionate, auditable and supportive.
Implementation learnings from EWS rollouts
The following learnings are drawn from practical EWS implementation patterns and technical architecture experience. They should be validated against each organization’s data maturity, legal context, culture and manager readiness.
| Learning | Technical implication | Business implication |
| HR-only data underpredicts early attrition risk. | Integrate operational systems and quality signals; create multi-source feature store. | Interventions become earlier and more specific. |
| Quality degradation is often visible before explicit sentiment. | Calculate self-baseline drift and corroborate with workload/context. | Managers get a support signal before a resignation conversation. |
| Text comments are high value but high risk. | Use governed NLP, raw-text minimization, access restrictions and redaction. | Trust improves when employees know the purpose and limits. |
| Alerts fail without an intervention playbook. | Connect reason codes to workflow actions and outcome capture. | HRBP capacity is protected and intervention quality becomes measurable. |
| Model accuracy alone is misleading. | Track precision@K, lead time, calibration, intervention lift and false-positive cost. | Leadership understands value in operational terms, not only AUC. |
| Manager behavior changes outcomes. | Include intervention feedback as a separate layer; do not blindly retrain on intervention-distorted labels. | Retention impact depends on manager capability, not only analytics. |
| Data quality varies by system. | Implement source reliability score, missingness handling and schema drift alerts. | Avoid overreacting to missing or noisy source feeds. |
| Trust is the adoption bottleneck. | Build transparency, audit trails, role segregation and employee communication. | Reduces perception of surveillance and improves program legitimacy. |
A recurring technical anti-pattern is treating attrition as a simple binary classification problem using annual HR snapshots. This creates delayed, coarse and often non-actionable predictions. The more mature pattern is a temporal decisioning system: time-indexed features, point-in-time labels, survival estimates, risk trajectory, reason-code stability and feedback from interventions.
How impact could have improved
Impact improves when the program moves from an analytics dashboard to an operating system for retention. The most important improvement areas are signal quality, temporal modelling, explainability, actionability, trust and causal measurement.
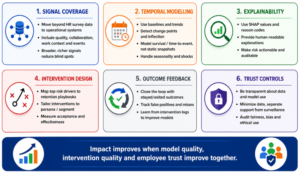
Figure 6. Six improvement levers for stronger predictability and business impact.
| Improvement lever | How it improves predictability | Implementation action |
| Broader signal coverage | Captures earlier operational deterioration not visible in HR data. | Prioritize connectors for JIRA/GitHub/Jenkins, ticketing, PMS, HRMS, LMS and finance systems. |
| Temporal modelling | Distinguishes stable low performance from sudden deterioration. | Use rolling windows, seasonality, EWMA, CUSUM and survival analysis. |
| Context-aware baselines | Reduces false positives caused by role, project or seasonality differences. | Build peer cohorts by role, grade, project, manager and work pattern. |
| Better text understanding | Detects career, workload, manager, compensation and frustration themes. | Fine-tune domain NLP; use human validation; track model drift in language patterns. |
| Intervention measurement | Converts prediction into measurable retention impact. | Track action, acceptance, timing, outcome and reason-code resolution. |
| Causal/uplift modelling | Targets interventions where they can change outcomes. | Randomized or quasi-experimental evaluation where ethically and operationally feasible. |
| Trust-by-design | Improves adoption and reduces resistance. | Employee notice, transparency, access controls, no punitive use, review board. |
The most material improvement is moving from risk prediction to treatment-effect prediction. Risk prediction asks, “Who is likely to leave?” Uplift modelling asks, “Who is likely to stay if we intervene, and what type of intervention is likely to help?” This distinction prevents the organization from spending effort on employees who would stay anyway or on situations where the chosen intervention cannot change the outcome.
Measurement Framework and ROI logic
EWS success must be measured as a controlled operational program. The ideal design compares outcomes between similar high-risk groups with and without structured intervention, while respecting fairness and ethics. Where randomized experimentation is not acceptable, use matched cohorts, difference-in-differences, propensity scoring or phased rollout comparisons.
| Metric category | Metrics | Interpretation |
| Model quality | AUC/PR-AUC, precision@K, recall, Brier score, calibration curve, lead time | Determines whether the model can reliably prioritize attention. |
| Alert quality | Alert volume, suppression rate, reason-code clarity, HRBP validation rate | Determines whether the alert queue is operationally usable. |
| Intervention quality | Time to first action, playbook fit, manager follow-through, employee response | Determines whether risk can be translated into support. |
| Business impact | Regretted attrition reduction, replacement-cost avoided, productivity continuity, project-risk reduction | Determines whether the program produces measurable value. |
| Trust and compliance | Access audit, complaint count, fairness metrics, data-retention compliance, DPIA/impact-assessment findings | Determines whether value is achieved without unacceptable harm. |
Illustrative ROI formula: Avoided attrition value = number of incremental retained regretted employees multiplied by estimated replacement and productivity-loss cost, minus program cost and intervention cost. Incrementally retained employees must be measured against a baseline or control, not merely counted from employees who stayed after being flagged.
Conclusion
An AI-enabled employee sentiment and attrition EWS is technically feasible and strategically valuable only when it is built as an enterprise trust system. The core architecture must integrate operational systems, quality trend signals, HR context and governed text analytics. The core model must be temporal, explainable and intervention-aware. The core operating model must keep humans in the loop and protect employees from punitive or opaque use.
The biggest implementation learning is that predictive power and business impact are different. Predictive power comes from multi-source signals, temporal features and robust models. Business impact comes from earlier action, better interventions, manager accountability, employee trust and measured feedback. A mature EWS does not replace leadership judgement; it equips leadership to notice risk earlier, respond more fairly and retain critical talent more deliberately.
Sources used and Evidence basis
| ID | Source | Title | Used for | Link |
| S1 | NIST | AI Risk Management Framework (AI RMF 1.0) | Framework for managing AI risks to individuals, organizations and society. | https://www.nist.gov/itl/ai-risk-management-framework |
| S2 | Microsoft | Responsible AI principles and Responsible AI Standard v2 | Fairness, reliability/safety, privacy/security, transparency, accountability and human oversight. | https://www.microsoft.com/en-us/ai/responsible-ai |
| S3 | European Union | EU AI Act and Annex III high-risk systems | Employment and worker-management AI is treated as high-risk in relevant uses; workplace AI has strict controls. | https://digital-strategy.ec.europa.eu/en/policies/regulatory-framework-ai |
| S4 | Government of India / MeitY | Digital Personal Data Protection Act, 2023 | Personal-data processing framework recognizing protection of personal data and lawful processing purposes. | https://www.meity.gov.in/ |
| S5 | Lundberg and Lee | A Unified Approach to Interpreting Model Predictions, 2017 | Introduces SHAP as a unified additive explanation method for model predictions. | https://arxiv.org/abs/1705.07874 |
| S6 | Mohbey et al. | Employee attrition prediction using survival analysis and Cox proportional hazard model, 2022 | Use of survival analysis and Cox methodology for employee turnover timing. | https://www.inderscienceonline.com/doi/10.1504/IJDET.2022.124986 |
| S7 | Wiley Engineering Reports | Machine Learning Approaches for Predicting Employee Turnover: systematic review, 2025 | Systematic review of machine-learning techniques used for turnover prediction. | https://onlinelibrary.wiley.com/doi/10.1002/eng2.70298 |
| S8 | Kaggle / IBM HR Analytics synthetic dataset | IBM HR Analytics Employee Attrition & Performance dataset | Common benchmark dataset for attrition modelling experiments; not a production data source. | https://www.kaggle.com/datasets/pavansubhasht/ibm-hr-analytics-attrition-dataset |
| S9 | Díaz et al. | Analyzing Employee Attrition Using Explainable AI for Strategic HR Decision-Making, 2023 | Use of explainable AI for identifying turnover drivers and transparency. | https://riunet.upv.es/ |
| S10 | Reuters / EU AI Act guidance reporting | EU guidance on prohibited and regulated AI practices in workplaces, 2025 | Useful external reminder that workplace emotion recognition and monitoring require strong legal scrutiny. | https://www.reuters.com/technology/artificial-intelligence/ |
Note on evidence: this white paper uses public frameworks and research sources to define reference architecture and algorithmic design. It does not claim measured client-specific attrition reduction unless a deployment produces controlled impact data.